
Today, SaaS has become the go-to model for delivering software solutions to businesses and consumers alike. As the demand for SaaS products continues to grow, so does the need for effective tools to monitor, analyze, and optimize performance.
Enter the SaaS dashboard – a powerful tool that provides real-time insights into key metrics, helping businesses make data-driven decisions and drive success.
In this post, we'll explore SaaS dashboard examples, highlighting their key metrics functionality, and discover how you can build your own.
SaaS dashboard examples
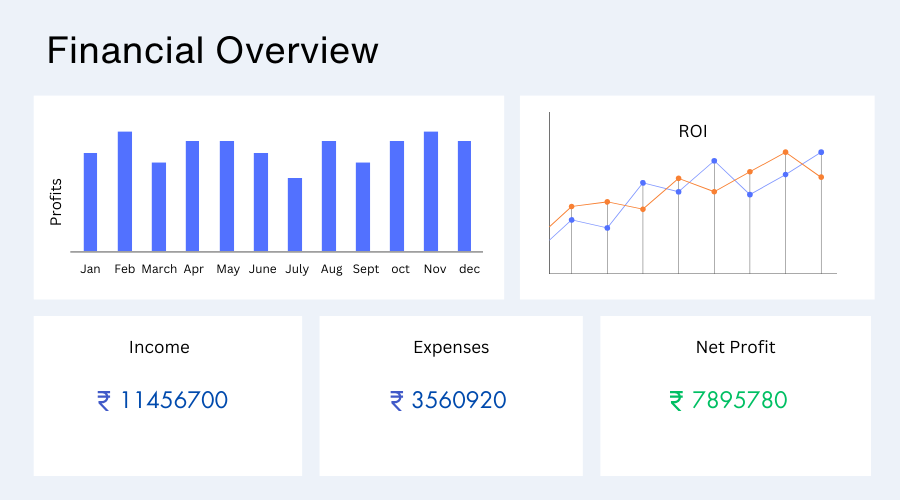
Finance Dashboard
Keeping tabs on your finances is crucial for business success. A finance dashboard does just that, providing a clear snapshot of your financial health. It shows key metrics like net profit margin, cash flow, and operating expenses, helping you make informed decisions to manage costs and plan for growth.
Key metrics
- Net Profit Margin: Percentage of revenue remaining after deducting operating expenses, taxes, and costs.
- Booking: Value of contracts signed in a specific period.
- Cash Flow: Total amount of money transferred into and out of a business.
- Operating Expenses: Cost incurred from core business operations.
- ROI (Return on Investment): Measures the profitability of an investment.
- Realized Revenue: Revenue earned and reported.
Here's a SaaS dashboard template example for managing finances;
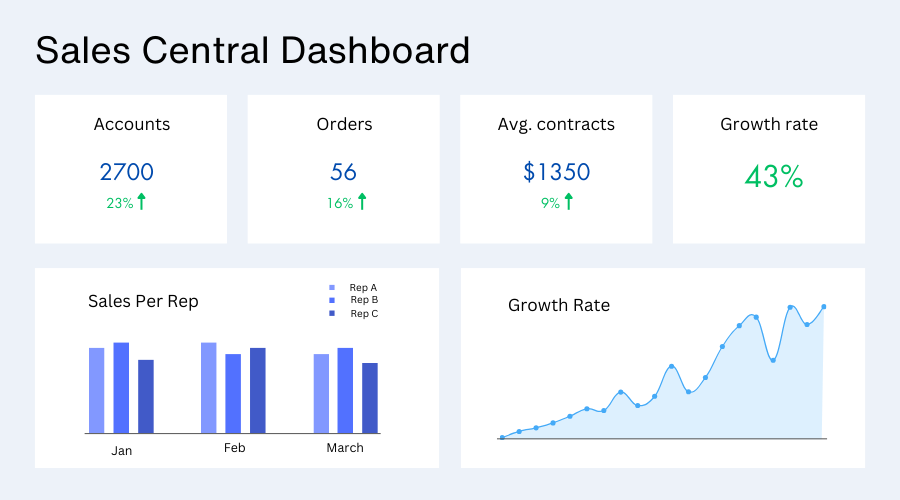
Sales Dashboard
In the fast-paced world of sales, staying on top of your game is essential. A sales dashboard gives you the edge by tracking your progress, analyzing trends, and optimizing your strategies. From pipeline analysis to win/loss insights, it helps you focus on what matters most: hitting your sales targets and growing revenue.
Key metrics
- Pipeline Analysis: Tracks the progress of deals through the sales pipeline.
- Win/Loss Analysis: Identifies reasons for winning or losing deals.
- Sales Performance Metrics: Conversion rates, average deal size, and sales velocity.
- Lead Generation Metrics: Effectiveness of lead generation efforts.
- Customer Acquisition Cost (CAC): Cost of acquiring new customers
Sales dashboard template overview for your reference;
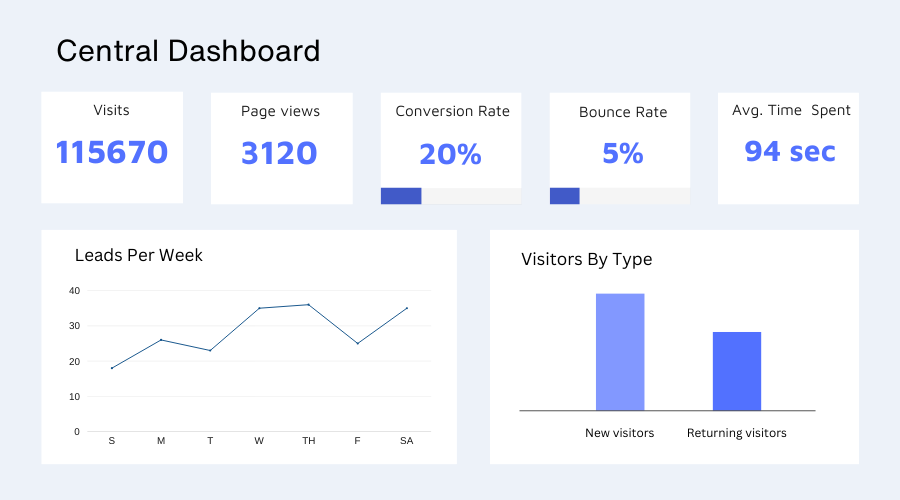
Marketing Dashboard
Marketing is all about making an impact, and a marketing dashboard helps you do just that. It evaluates the effectiveness of your campaigns, channels, and messaging, providing valuable insights to optimize your marketing efforts. From website traffic to social media engagement, it guides you in allocating resources wisely and driving better results.
Key metrics
- Website Traffic: Number of visitors to the website.
- Lead Generation Metrics: Effectiveness of marketing campaigns in generating leads.
- Conversion Rate: Percentage of visitors who take a desired action.
- Email Marketing Metrics: Email open rates, click-through rates, and conversions.
- Social Media Metrics: Engagement, reach, and conversions from social media platforms.
Refer to the following SaaS analytics dashboard design for the marketing dashboard to get an overview;
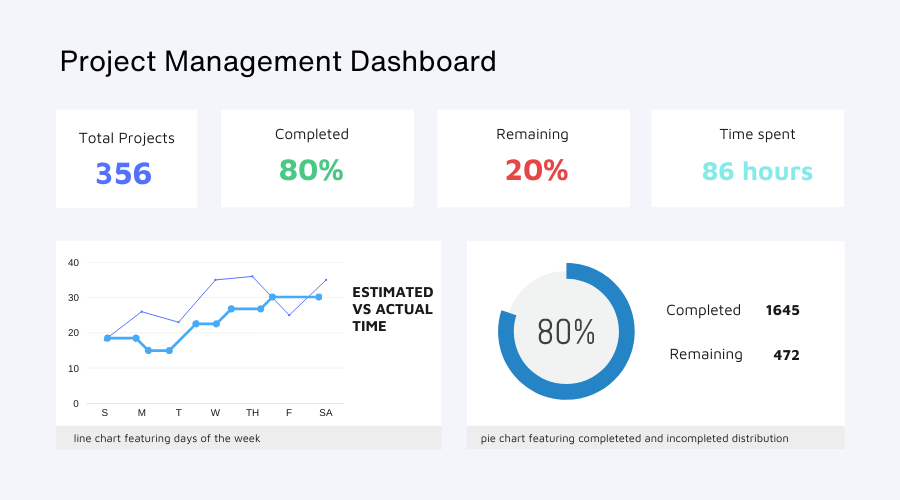
Project Management Dashboard
Projects can be complex, but managing them doesn't have to be. A project management dashboard offers clarity and control, giving you insights into project progress, resource allocation, and risk management. It helps you keep projects on track, communicate effectively with stakeholders, and overcome challenges to achieve your goals.
Key metrics
- Project Progress: Status of individual projects and overall project portfolio.
- Resource Allocation: Allocation of resources such as time, budget, and manpower.
- Task Management Metrics: Task completion rates, deadlines met, and dependencies.
- Risk Management Metrics: Identification and assessment of project risks and mitigation efforts.
- Client Satisfaction: Feedback and satisfaction with project deliverables.
Here's a project management SaaS analytics dashboard for your reference'
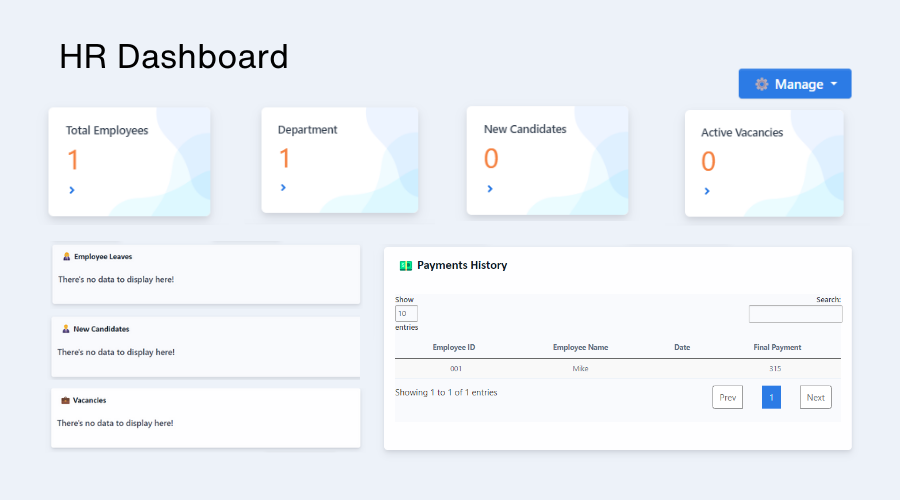
HR Dashboard
An HR dashboard helps you monitor key metrics like employee turnover, recruitment effectiveness, and workforce engagement. It guides you in attracting, retaining, and developing top talent, fostering a positive organizational culture and driving long-term success.
Key metrics
- Employee Turnover Rate: Percentage of employees leaving the company within a specific period.
- Recruitment Metrics: Time-to-hire, cost-per-hire, and other recruitment process metrics.
- Employee Engagement: Employee satisfaction, morale, and commitment to the organization.
- Training and Development Metrics: Employee training participation and effectiveness.
- Diversity and Inclusion Metrics: Diversity and inclusion efforts within the organization.
The following HR SaaS dashboard template design can help you get an overview.
Start building your SaaS dashboard
Define your objectives
Clearly define the goals and objectives of your SaaS dashboard. Determine what key metrics and insights you want to track and how the dashboard will help users monitor and manage their SaaS usage or performance.
Understand your users
Identify your target users and understand their needs, preferences, and pain points. Consider what information they need to make informed decisions and how they prefer to visualize data.
Choose the right metrics
Select the most relevant metrics and KPIs (Key Performance Indicators) to include in your dashboard. These may include user engagement, subscription growth, churn rate, revenue metrics, customer satisfaction, and more.
Select your software
Select the appropriate software for building and deploying your SaaS dashboard. Consider factors such as ease of use, scalability, integration capabilities, and cost.
One popular that stands out is Fuzen. Fuzen is a no code platform specifically dedicated to build SaaS products. You can easily build all the above listed dashboards on Fuzen without any coding skills.
Design the dashboard layout
Design an intuitive and user-friendly layout for your dashboard. Organize information logically, prioritize important metrics, and ensure easy navigation. Consider using visual elements such as charts, graphs, and tables to present data effectively.
Test and iterate
Test the dashboard thoroughly to identify any usability issues, performance bottlenecks, or bugs. Gather feedback from users and iterate on the design and functionality to continuously improve the dashboard's effectiveness and usability.
Conclusion
SaaS dashboards play a pivotal role in the success of modern businesses by providing real-time visibility into key metrics and performance indicators.
Whether it's monitoring financial health, tracking sales performance, optimizing marketing efforts, managing projects, or streamlining human resources, SaaS dashboards offer invaluable insights that drive informed decision-making and strategic growth.
If you are looking to build one, try Fuzen - your go-to choice for developing SaaS products.
FAQs
1. What is a SaaS dashboard?
A SaaS dashboard is a tool that provides real-time insights into key metrics and performance indicators of a business. It helps businesses track and optimize their operations in areas like finance, sales, marketing, and HR.
2. How can I benefit from using a SaaS dashboard?
A SaaS dashboard gives you a clear overview of your business performance, enabling you to make data-driven decisions. It helps you monitor key metrics, streamline operations, and optimize strategies for growth and efficiency.
3. Can I build a SaaS dashboard without coding skills?
Yes! Platforms like Fuzen, a no-code platform, allow you to create custom SaaS dashboards without any coding knowledge. With an intuitive interface, you can build dashboards tailored to your business needs in no time.
4. What key metrics should I track in my SaaS dashboard?
Key metrics depend on your business goals. Common metrics include revenue growth, customer churn rate, user engagement, sales pipeline performance, and customer satisfaction. Choose metrics that align with your objectives.
5. How do I design an effective SaaS dashboard?
An effective SaaS dashboard should be user-friendly and intuitive. Focus on clear visualizations of key metrics, logical data organization, and easy navigation. Tools like Fuzen make it easier to design and customize your dashboard.
6. What tools can I use to build my SaaS dashboard?
There are several tools available, but Fuzen is a great option for building SaaS dashboards. It’s a no-code platform designed to help businesses create custom solutions quickly and efficiently.